(Please CC me, I'm subbed to LKML).
My G5, while running practically nothing (just sshd and some to watch the
load), has a weird cycle of load averages. I think it might be related to MD,
simply because that's the only thing that is clocking up cputime.
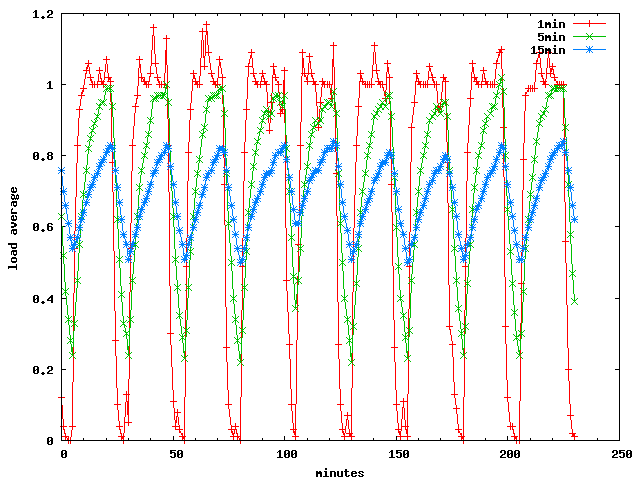
A full cycle lasts approximately 27 minutes.
Mins Load
0-2 0.0-0.15 (stable, 0 level)
3-5 0.50, 0.80, 0.95 (fast increase)
6-21 0.95-1.10 (stable, 1 level)
22-24 0.9, 0.8, 0.1 (fast decrease, to 0 level)
25-27 0.2, 0.3, 0.15 (local maxima peak)
Here's a graph of it, spanning 230 minutes:
http://dev.gentoo.org/~robbat2/20071230-g5-loadavg-bug.png
Processed data for the graph here:
http://dev.gentoo.org/~robbat2/20071230-g5-loadavg-bug.txt
For the entire 230 minute period, there was _no_ disk I/O.
Not recorded by iostat, nor generated.
# while true ; do uptime ; iostat -t 60 2 -N -d | tail -n15 ; done >/dev/shm/foo
Example of single output pass for the above loop:
00:59:37 up 8:32, 2 users, load average: 0.02, 0.47, 0.66
Device: tps Blk_read/s Blk_wrtn/s Blk_read Blk_wrtn
sda 0.00 0.00 0.00 0 0
sdb 0.00 0.00 0.00 0 0
md1 0.00 0.00 0.00 0 0
md0 0.00 0.00 0.00 0 0
md2 0.00 0.00 0.00 0 0
md3 0.00 0.00 0.00 0 0
vg-usr 0.00 0.00 0.00 0 0
vg-var 0.00 0.00 0.00 0 0
vg-tmp 0.00 0.00 0.00 0 0
vg-opt 0.00 0.00 0.00 0 0
vg-home 0.00 0.00 0.00 0 0
vg-usr_src 0.00 0.00 0.00 0 0
vg-usr_portage 0.00 0.00 0.00 0 0
This is basically 1842c7f2 from Linus's tree, my own stuff is config'd out with
=n for the moment. And the problem does still occur in the main tree.
Snippet from the head of 'top', sorting by cputime.
top - 01:59:08 up 9:32, 2 users, load average: 1.04, 0.87, 0.70
Tasks: 74 total, 1 running, 73 sleeping, 0 stopped, 0 zombie
Cpu0 : 0.0%us, 0.0%sy, 0.0%ni,100.0%id, 0.0%wa, 0.0%hi, 0.0%si, 0.0%st
Cpu1 : 0.0%us, 0.5%sy, 0.0%ni, 99.5%id, 0.0%wa, 0.0%hi, 0.0%si, 0.0%st
Cpu2 : 0.0%us, 0.2%sy, 0.0%ni, 99.8%id, 0.0%wa, 0.0%hi, 0.0%si, 0.0%st
Cpu3 : 0.0%us, 0.0%sy, 0.0%ni,100.0%id, 0.0%wa, 0.0%hi, 0.0%si, 0.0%st
Mem: 12074480k total, 292520k used, 11781960k free, 76812k buffers
Swap: 8388536k total, 0k used, 8388536k free, 144276k cached
PID USER PR NI VIRT RES SHR S %CPU %MEM TIME+ COMMAND
4635 root 15 -5 0 0 0 S 0 0.0 8:14.33 md3_raid1
3121 root 15 -5 0 0 0 S 1 0.0 3:15.12 md2_raid1
3098 root 15 -5 0 0 0 S 0 0.0 3:07.83 md1_raid1
3076 root 15 -5 0 0 0 S 0 0.0 0:45.82 md0_raid1
829 root 15 -5 0 0 0 D 0 0.0 0:01.85 kwindfarm
13 root 15 -5 0 0 0 S 0 0.0 0:01.41 ksoftirqd/3
18 root 15 -5 0 0 0 S 0 0.0 0:01.39 events/3
10 root 15 -5 0 0 0 S 0 0.0 0:00.94 ksoftirqd/2
1 root 20 0 1900 652 576 S 0 0.0 0:00.89 init
32086 root 20 0 9336 2696 2076 S 0 0.0 0:00.87 sshd
# ver_linux
Linux buck-int 2.6.24-rc6-prod-g6f0f5304 #10 SMP Sat Dec 29 05:11:24 PST 2007 ppc64 PPC970MP, altivec supported PowerMac11,2 GNU/Linux
Gnu C 4.2.2
Gnu make 3.81
binutils 2.18
util-linux 2.13
mount 2.13
module-init-tools 3.4
e2fsprogs 1.40.3
reiserfsprogs 3.6.19
xfsprogs 2.9.4
quota-tools 3.15.
PPP 2.4.4
Linux C Library 2.7
Dynamic linker (ldd) 2.7
Procps 3.2.7
Net-tools 1.60
Kbd 1.13
Sh-utils 6.9
udev 118
wireless-tools 29
Modules Loaded nfsd exportfs auth_rpcgss ipv6 unix tg3 nfs_acl lockd sunrpc dm_mod
# lsmod
Module Size Used by
nfsd 346552 1
exportfs 8392 1 nfsd
auth_rpcgss 69152 1 nfsd
ipv6 428760 20
unix 47384 13
tg3 159020 0
nfs_acl 6056 1 nfsd
lockd 105248 1 nfsd
sunrpc 281248 6 nfsd,auth_rpcgss,nfs_acl,lockd
dm_mod 100520 15
# ps -ef
UID PID PPID C STIME TTY TIME CMD
root 1 0 0 Dec29 ? 00:00:00 init [3]
root 2 0 0 Dec29 ? 00:00:00 [kthreadd]
root 3 2 0 Dec29 ? 00:00:00 [migration/0]
root 4 2 0 Dec29 ? 00:00:00 [ksoftirqd/0]
root 5 2 0 Dec29 ? 00:00:00 [watchdog/0]
root 6 2 0 Dec29 ? 00:00:00 [migration/1]
root 7 2 0 Dec29 ? 00:00:00 [ksoftirqd/1]
root 8 2 0 Dec29 ? 00:00:00 [watchdog/1]
root 9 2 0 Dec29 ? 00:00:00 [migration/2]
root 10 2 0 Dec29 ? 00:00:00 [ksoftirqd/2]
root 11 2 0 Dec29 ? 00:00:00 [watchdog/2]
root 12 2 0 Dec29 ? 00:00:00 [migration/3]
root 13 2 0 Dec29 ? 00:00:01 [ksoftirqd/3]
root 14 2 0 Dec29 ? 00:00:00 [watchdog/3]
root 15 2 0 Dec29 ? 00:00:00 [events/0]
root 16 2 0 Dec29 ? 00:00:00 [events/1]
root 17 2 0 Dec29 ? 00:00:00 [events/2]
root 18 2 0 Dec29 ? 00:00:01 [events/3]
root 19 2 0 Dec29 ? 00:00:00 [khelper]
root 103 2 0 Dec29 ? 00:00:00 [kblockd/0]
root 104 2 0 Dec29 ? 00:00:00 [kblockd/1]
root 105 2 0 Dec29 ? 00:00:00 [kblockd/2]
root 106 2 0 Dec29 ? 00:00:00 [kblockd/3]
root 114 2 0 Dec29 ? 00:00:00 [ata/0]
root 115 2 0 Dec29 ? 00:00:00 [ata/1]
root 116 2 0 Dec29 ? 00:00:00 [ata/2]
root 117 2 0 Dec29 ? 00:00:00 [ata/3]
root 118 2 0 Dec29 ? 00:00:00 [ata_aux]
root 119 2 0 Dec29 ? 00:00:00 [ksuspend_usbd]
root 125 2 0 Dec29 ? 00:00:00 [khubd]
root 128 2 0 Dec29 ? 00:00:00 [kseriod]
root 155 2 0 Dec29 ? 00:00:00 [pdflush]
root 156 2 0 Dec29 ? 00:00:00 [pdflush]
root 157 2 0 Dec29 ? 00:00:00 [kswapd0]
root 205 2 0 Dec29 ? 00:00:00 [aio/0]
root 206 2 0 Dec29 ? 00:00:00 [aio/1]
root 207 2 0 Dec29 ? 00:00:00 [aio/2]
root 208 2 0 Dec29 ? 00:00:00 [aio/3]
root 829 2 0 Dec29 ? 00:00:01 [kwindfarm]
root 841 2 0 Dec29 ? 00:00:00 [scsi_eh_0]
root 843 2 0 Dec29 ? 00:00:00 [scsi_eh_1]
root 845 2 0 Dec29 ? 00:00:00 [scsi_eh_2]
root 847 2 0 Dec29 ? 00:00:00 [scsi_eh_3]
root 2531 2 0 Dec29 ? 00:00:00 [rpciod/0]
root 2532 2 0 Dec29 ? 00:00:00 [rpciod/1]
root 2533 2 0 Dec29 ? 00:00:00 [rpciod/2]
root 2534 2 0 Dec29 ? 00:00:00 [rpciod/3]
root 3076 2 0 Dec29 ? 00:00:45 [md0_raid1]
root 3098 2 0 Dec29 ? 00:03:07 [md1_raid1]
root 3121 2 0 Dec29 ? 00:03:14 [md2_raid1]
root 3169 2 0 Dec29 ? 00:00:00 [kjournald]
root 3285 1 0 Dec29 ? 00:00:00 /sbin/udevd --daemon
root 4635 2 1 Dec29 ? 00:08:12 [md3_raid1]
root 4740 2 0 Dec29 ? 00:00:00 [kjournald]
root 4741 2 0 Dec29 ? 00:00:00 [kjournald]
root 4742 2 0 Dec29 ? 00:00:00 [kjournald]
root 4743 2 0 Dec29 ? 00:00:00 [reiserfs/0]
root 4744 2 0 Dec29 ? 00:00:00 [reiserfs/1]
root 4745 2 0 Dec29 ? 00:00:00 [reiserfs/2]
root 4746 2 0 Dec29 ? 00:00:00 [reiserfs/3]
root 4747 2 0 Dec29 ? 00:00:00 [kjournald]
root 5663 32089 0 01:57 pts/1 00:00:00 ps -ef
root 7324 1 0 Dec29 ? 00:00:00 /sbin/dhcpcd -h buck-int -t 10 -R -N -Y -I -R -N -Y eth0
root 8340 1 0 Dec29 ? 00:00:00 /usr/sbin/sshd
root 8517 1 0 Dec29 tty1 00:00:00 /sbin/agetty 38400 tty1 linux
root 8518 1 0 Dec29 tty2 00:00:00 /sbin/agetty 38400 tty2 linux
root 8519 1 0 Dec29 tty3 00:00:00 /sbin/agetty 38400 tty3 linux
root 8521 1 0 Dec29 tty4 00:00:00 /sbin/agetty 38400 tty4 linux
root 8522 1 0 Dec29 tty5 00:00:00 /sbin/agetty 38400 tty5 linux
root 8524 1 0 Dec29 tty6 00:00:00 /sbin/agetty 38400 tty6 linux
root 9436 8340 0 Dec29 ? 00:00:00 sshd: root@pts/0
root 9440 9436 0 Dec29 pts/0 00:00:00 -bash
root 32086 8340 0 Dec29 ? 00:00:00 sshd: root@pts/1
root 32089 32086 0 Dec29 pts/1 00:00:00 -bash
--
Robin Hugh Johnson
Gentoo Linux Developer & Infra Guy
E-Mail : [email protected]
GnuPG FP : 11AC BA4F 4778 E3F6 E4ED F38E B27B 944E 3488 4E85
On Sun, 30 Dec 2007 02:06:14 -0800 "Robin H. Johnson" <[email protected]> wrote:
> (Please CC me, I'm subbed to LKML).
>
> My G5, while running practically nothing (just sshd and some to watch the
> load), has a weird cycle of load averages. I think it might be related to MD,
> simply because that's the only thing that is clocking up cputime.
Usually this is caused by a process which is stuck in "D" state
(uninterruptible sleep) when it shouldn't be.
Check this by running `ps aux' or whatever.
> A full cycle lasts approximately 27 minutes.
> Mins Load
> 0-2 0.0-0.15 (stable, 0 level)
> 3-5 0.50, 0.80, 0.95 (fast increase)
> 6-21 0.95-1.10 (stable, 1 level)
> 22-24 0.9, 0.8, 0.1 (fast decrease, to 0 level)
> 25-27 0.2, 0.3, 0.15 (local maxima peak)
>
> Here's a graph of it, spanning 230 minutes:
> http://dev.gentoo.org/~robbat2/20071230-g5-loadavg-bug.png
>
> Processed data for the graph here:
> http://dev.gentoo.org/~robbat2/20071230-g5-loadavg-bug.txt
>
> For the entire 230 minute period, there was _no_ disk I/O.
> Not recorded by iostat, nor generated.
>
> # while true ; do uptime ; iostat -t 60 2 -N -d | tail -n15 ; done >/dev/shm/foo
>
> Example of single output pass for the above loop:
> 00:59:37 up 8:32, 2 users, load average: 0.02, 0.47, 0.66
> Device: tps Blk_read/s Blk_wrtn/s Blk_read Blk_wrtn
> sda 0.00 0.00 0.00 0 0
> sdb 0.00 0.00 0.00 0 0
> md1 0.00 0.00 0.00 0 0
> md0 0.00 0.00 0.00 0 0
> md2 0.00 0.00 0.00 0 0
> md3 0.00 0.00 0.00 0 0
> vg-usr 0.00 0.00 0.00 0 0
> vg-var 0.00 0.00 0.00 0 0
> vg-tmp 0.00 0.00 0.00 0 0
> vg-opt 0.00 0.00 0.00 0 0
> vg-home 0.00 0.00 0.00 0 0
> vg-usr_src 0.00 0.00 0.00 0 0
> vg-usr_portage 0.00 0.00 0.00 0 0
>
> This is basically 1842c7f2 from Linus's tree, my own stuff is config'd out with
> =n for the moment. And the problem does still occur in the main tree.
>
> Snippet from the head of 'top', sorting by cputime.
>
> top - 01:59:08 up 9:32, 2 users, load average: 1.04, 0.87, 0.70
> Tasks: 74 total, 1 running, 73 sleeping, 0 stopped, 0 zombie
> Cpu0 : 0.0%us, 0.0%sy, 0.0%ni,100.0%id, 0.0%wa, 0.0%hi, 0.0%si, 0.0%st
> Cpu1 : 0.0%us, 0.5%sy, 0.0%ni, 99.5%id, 0.0%wa, 0.0%hi, 0.0%si, 0.0%st
> Cpu2 : 0.0%us, 0.2%sy, 0.0%ni, 99.8%id, 0.0%wa, 0.0%hi, 0.0%si, 0.0%st
> Cpu3 : 0.0%us, 0.0%sy, 0.0%ni,100.0%id, 0.0%wa, 0.0%hi, 0.0%si, 0.0%st
> Mem: 12074480k total, 292520k used, 11781960k free, 76812k buffers
> Swap: 8388536k total, 0k used, 8388536k free, 144276k cached
>
> PID USER PR NI VIRT RES SHR S %CPU %MEM TIME+ COMMAND
> 4635 root 15 -5 0 0 0 S 0 0.0 8:14.33 md3_raid1
> 3121 root 15 -5 0 0 0 S 1 0.0 3:15.12 md2_raid1
> 3098 root 15 -5 0 0 0 S 0 0.0 3:07.83 md1_raid1
> 3076 root 15 -5 0 0 0 S 0 0.0 0:45.82 md0_raid1
> 829 root 15 -5 0 0 0 D 0 0.0 0:01.85 kwindfarm
> 13 root 15 -5 0 0 0 S 0 0.0 0:01.41 ksoftirqd/3
> 18 root 15 -5 0 0 0 S 0 0.0 0:01.39 events/3
> 10 root 15 -5 0 0 0 S 0 0.0 0:00.94 ksoftirqd/2
> 1 root 20 0 1900 652 576 S 0 0.0 0:00.89 init
> 32086 root 20 0 9336 2696 2076 S 0 0.0 0:00.87 sshd
>From that I'd suspect that kwindfarm is being a bad citizen.
If a process is consistently stuck in D state, run
echo w > /proc/sysrq-trigger
then record the resulting dmesg output so we can see where it got stuck.
On Sat, Jan 05, 2008 at 01:30:37AM -0800, Andrew Morton wrote:
> >From that I'd suspect that kwindfarm is being a bad citizen.
> If a process is consistently stuck in D state, run
Windfarm.
> echo w > /proc/sysrq-trigger
> then record the resulting dmesg output so we can see where it got stuck.
Traceback:
[552710.416174] SysRq : Show Blocked State
[552710.417876] task PC stack pid father
[552710.417888] kwindfarm D 0000000000000000 0 829 2
[552710.417892] Call Trace:
[552710.417895] [c00000036c9835f0] [c000000000528b90] 0xc000000000528b90 (unreliable)
[552710.417908] [c00000036c9837c0] [c00000000000f4a8] .__switch_to+0xd8/0x110
[552710.417985] [c00000036c983850] [c0000000003bb2a0] .schedule+0x62c/0x6c8
[552710.417992] [c00000036c983940] [c0000000003bb8c4] .schedule_timeout+0x3c/0xe8
[552710.417997] [c00000036c983a10] [c0000000003bb51c] .wait_for_common+0x100/0x1bc
[552710.418002] [c00000036c983ae0] [c000000000285300] .smu_fan_set+0x17c/0x1e4
[552710.418009] [c00000036c983c30] [c000000000284078] .pm112_wf_notify+0xc50/0x12d0
[552710.418015] [c00000036c983d20] [c0000000003bfb84] .notifier_call_chain+0x5c/0xcc
[552710.418021] [c00000036c983dc0] [c00000000006f4b4] .__blocking_notifier_call_chain+0x70/0xb0
[552710.418027] [c00000036c983e70] [c000000000282d9c] .wf_thread_func+0x78/0x11c
[552710.418032] [c00000036c983f00] [c000000000069b00] .kthread+0x78/0xc4
[552710.418039] [c00000036c983f90] [c000000000023d0c] .kernel_thread+0x4c/0x68
[552710.418064] Sched Debug Version: v0.07, 2.6.24-rc6-prod-g6f0f5304 #10
[552710.418067] now at 552723945.170635 msecs
[552710.418070] .sysctl_sched_latency : 60.000000
[552710.418073] .sysctl_sched_min_granularity : 12.000000
[552710.418076] .sysctl_sched_wakeup_granularity : 30.000000
[552710.418079] .sysctl_sched_batch_wakeup_granularity : 30.000000
[552710.418082] .sysctl_sched_child_runs_first : 0.000001
[552710.418085] .sysctl_sched_features : 7
Full output at
http://dev.gentoo.org/~robbat2/20080105_windfarm_sysrq_w.txt
--
Robin Hugh Johnson
Gentoo Linux Developer & Infra Guy
E-Mail : [email protected]
GnuPG FP : 11AC BA4F 4778 E3F6 E4ED F38E B27B 944E 3488 4E85
On Sat, 2008-01-05 at 02:04 -0800, Robin H. Johnson wrote:
> On Sat, Jan 05, 2008 at 01:30:37AM -0800, Andrew Morton wrote:
> > >From that I'd suspect that kwindfarm is being a bad citizen.
> > If a process is consistently stuck in D state, run
> Windfarm.
It's an unfortunate artifact that kernel threads that do
non-interruptible sleep are counted as load...
In the case of windfarm, it does a lot (a _LOT_) of accesses to various
i2c busses and the SMU (the system management unit which controls the
fans). All those are done in the form of short requests during which the
process is doing a wait_for_completion() or similar.
I don't see a better way to do that, I think we could have good use of
something that stops counting those in the load average...
Ben.
> > echo w > /proc/sysrq-trigger
> > then record the resulting dmesg output so we can see where it got stuck.
>
> Traceback:
> [552710.416174] SysRq : Show Blocked State
> [552710.417876] task PC stack pid father
> [552710.417888] kwindfarm D 0000000000000000 0 829 2
> [552710.417892] Call Trace:
> [552710.417895] [c00000036c9835f0] [c000000000528b90] 0xc000000000528b90 (unreliable)
> [552710.417908] [c00000036c9837c0] [c00000000000f4a8] .__switch_to+0xd8/0x110
> [552710.417985] [c00000036c983850] [c0000000003bb2a0] .schedule+0x62c/0x6c8
> [552710.417992] [c00000036c983940] [c0000000003bb8c4] .schedule_timeout+0x3c/0xe8
> [552710.417997] [c00000036c983a10] [c0000000003bb51c] .wait_for_common+0x100/0x1bc
> [552710.418002] [c00000036c983ae0] [c000000000285300] .smu_fan_set+0x17c/0x1e4
> [552710.418009] [c00000036c983c30] [c000000000284078] .pm112_wf_notify+0xc50/0x12d0
> [552710.418015] [c00000036c983d20] [c0000000003bfb84] .notifier_call_chain+0x5c/0xcc
> [552710.418021] [c00000036c983dc0] [c00000000006f4b4] .__blocking_notifier_call_chain+0x70/0xb0
> [552710.418027] [c00000036c983e70] [c000000000282d9c] .wf_thread_func+0x78/0x11c
> [552710.418032] [c00000036c983f00] [c000000000069b00] .kthread+0x78/0xc4
> [552710.418039] [c00000036c983f90] [c000000000023d0c] .kernel_thread+0x4c/0x68
> [552710.418064] Sched Debug Version: v0.07, 2.6.24-rc6-prod-g6f0f5304 #10
> [552710.418067] now at 552723945.170635 msecs
> [552710.418070] .sysctl_sched_latency : 60.000000
> [552710.418073] .sysctl_sched_min_granularity : 12.000000
> [552710.418076] .sysctl_sched_wakeup_granularity : 30.000000
> [552710.418079] .sysctl_sched_batch_wakeup_granularity : 30.000000
> [552710.418082] .sysctl_sched_child_runs_first : 0.000001
> [552710.418085] .sysctl_sched_features : 7
>
> Full output at
> http://dev.gentoo.org/~robbat2/20080105_windfarm_sysrq_w.txt
>
On Sat, 05 Jan 2008 21:18:52 +1100 Benjamin Herrenschmidt <[email protected]> wrote:
> On Sat, 2008-01-05 at 02:04 -0800, Robin H. Johnson wrote:
> > On Sat, Jan 05, 2008 at 01:30:37AM -0800, Andrew Morton wrote:
> > > >From that I'd suspect that kwindfarm is being a bad citizen.
> > > If a process is consistently stuck in D state, run
> > Windfarm.
>
> It's an unfortunate artifact that kernel threads that do
> non-interruptible sleep are counted as load...
>
> In the case of windfarm, it does a lot (a _LOT_) of accesses to various
> i2c busses and the SMU (the system management unit which controls the
> fans). All those are done in the form of short requests during which the
> process is doing a wait_for_completion() or similar.
>
> I don't see a better way to do that, I think we could have good use of
> something that stops counting those in the load average...
Maybe, but we can usually work around it pretty comfortably.
If smu_set_fan() is only ever called by a kernel thread then we can simply
flip it over to using wait_for_completion_interruptible().
If smu_set_fan() is also called from user processes then things aren't so
easy...
> Maybe, but we can usually work around it pretty comfortably.
>
> If smu_set_fan() is only ever called by a kernel thread then we can simply
> flip it over to using wait_for_completion_interruptible().
Hrm... as of today, it's mostly called from a kernel thread but I don't
totally iron out the possibility that we add control to those things via
sysfs... But that's definitely an option for now.
However, that's only part of the problem. There's a lot of I2C accesses
(and other SMU accesses to read SMU based sensors) and I doubt we can
make all of that "magically" interruptible.
I would much prefer if we had a way to tag a kernel thread to not add to
the load average when in interruptible sleep :-)
> If smu_set_fan() is also called from user processes then things aren't so
> easy...
Ben.
Andrew Morton writes:
> Maybe, but we can usually work around it pretty comfortably.
>
> If smu_set_fan() is only ever called by a kernel thread then we can simply
> flip it over to using wait_for_completion_interruptible().
>
> If smu_set_fan() is also called from user processes then things aren't so
> easy...
I believe most of the time spent waiting is actually spent inside the
i2c layer in uninterruptible sleeps.
Robin, what does the "motherboard" line in /proc/cpuinfo say on your
machine?
Paul.
On Sun, Jan 06, 2008 at 10:21:57PM +1100, Paul Mackerras wrote:
> Robin, what does the "motherboard" line in /proc/cpuinfo say on your
> machine?
motherboard : PowerMac11,2 MacRISC4 Power Macintosh
--
Robin Hugh Johnson
Gentoo Linux Developer & Infra Guy
E-Mail : [email protected]
GnuPG FP : 11AC BA4F 4778 E3F6 E4ED F38E B27B 944E 3488 4E85