Hi Peter,
I can't find a good point of contact for perf, so I'm contacting you based on
the MAINTAINERS file; feel free to redirect somewhere if you're not the right
person.
I'm trying to figure out how to deal with perf report when there are inlined
functions; they don't generally seem to show up in the call stack, which
sometimes can make it very hard to figure out what is going, especially in
a code base one doesn't know too well. As an example, I threw together a
minimal test program:
#include <stdlib.h>
inline int foo()
{
int k = rand();
int sum = 1;
for (int i = 0; i < 10000000000; ++i)
{
sum ^= k;
sum += k;
}
return sum;
}
int main(void)
{
return foo();
}
Compiling with -O2 -g, and running perf record -g yields:
# Samples: 6K of event 'cycles:ppp'
# Event count (approx.): 5876825543
#
# Children Self Command Shared Object Symbol
# ........ ........ ....... ................. ......................
#
99.98% 99.98% inline inline [.] main
|
---0x706258d4c544155
main
99.98% 0.00% inline [unknown] [.] 0x0706258d4c544155
|
---0x706258d4c544155
main
Is there a way I can get it to show “foo” in the call graph? (I suppose also
ideally, “foo” and not “main” should show up in a non-graph run.) Of course,
this gets even more confusing if foo calls bar, since it now looks like the
call chain is main -> bar directly.
I have debug information that should be sufficient in the binary, because if
I break in gdb, I definitely get the call stack:
Program received signal SIGINT, Interrupt.
0x0000555555554589 in foo () at inline.c:5
5 int k = rand();
(gdb) bt
#0 0x0000555555554589 in foo () at inline.c:5
#1 main () at inline.c:17
(gdb)
FWIW, this is with perf from 4.10 (git as of a few days ago) and GCC 6.2.1.
/* Steinar */
--
Homepage: https://www.sesse.net/
On Tue, Dec 20, 2016 at 12:59:54PM +0100, Steinar H. Gunderson wrote:
> Hi Peter,
>
> I can't find a good point of contact for perf, so I'm contacting you based on
> the MAINTAINERS file; feel free to redirect somewhere if you're not the right
> person.
>
Cc'ed [email protected]
> I'm trying to figure out how to deal with perf report when there are inlined
> functions; they don't generally seem to show up in the call stack, which
> sometimes can make it very hard to figure out what is going, especially in
> a code base one doesn't know too well. As an example, I threw together a
> minimal test program:
>
> #include <stdlib.h>
>
> inline int foo()
> {
> int k = rand();
> int sum = 1;
> for (int i = 0; i < 10000000000; ++i)
> {
> sum ^= k;
> sum += k;
> }
> return sum;
> }
>
> int main(void)
> {
> return foo();
> }
>
> Compiling with -O2 -g, and running perf record -g yields:
>
> # Samples: 6K of event 'cycles:ppp'
> # Event count (approx.): 5876825543
> #
> # Children Self Command Shared Object Symbol
> # ........ ........ ....... ................. ......................
> #
> 99.98% 99.98% inline inline [.] main
> |
> ---0x706258d4c544155
> main
>
> 99.98% 0.00% inline [unknown] [.] 0x0706258d4c544155
> |
> ---0x706258d4c544155
> main
>
> Is there a way I can get it to show “foo” in the call graph? (I suppose also
> ideally, “foo” and not “main” should show up in a non-graph run.) Of course,
> this gets even more confusing if foo calls bar, since it now looks like the
> call chain is main -> bar directly.
>
> I have debug information that should be sufficient in the binary, because if
> I break in gdb, I definitely get the call stack:
>
> Program received signal SIGINT, Interrupt.
> 0x0000555555554589 in foo () at inline.c:5
> 5 int k = rand();
> (gdb) bt
> #0 0x0000555555554589 in foo () at inline.c:5
> #1 main () at inline.c:17
> (gdb)
>
> FWIW, this is with perf from 4.10 (git as of a few days ago) and GCC 6.2.1.
OK, so it might be possible with: perf record -g --call-graph dwarf
but that's fairly heavy on the overhead, it will dump the top-of-stack
for each sample (8k default) and unwind using libunwind in userspace.
The default mechanism used for call-graphs is frame-pointers which are
(relatively) simple and fast to traverse from kernel space. The down
side is of course that all your userspace needs to be compiled with
frame pointers enabled and inlined functions, as you noticed, are
'lost'.
There has been talk to attempt to utilize the ELF EH frames which are
mandatory in the x86_64 ABI (even for C) to attempt a kernel based
'DWARF' unwind, but nobody has put forward working code for this yet.
Also, even if the EH stuff is mapped at runtime, it doesn't mean the
pages will actually be loaded (due to demand paging) and available for
use, which also will limit usability. (perf sampling is using
interrupt/NMI context and we cannot page from that, so we're limited to
memory that's present.)
On Tuesday, December 20, 2016 1:17:55 PM CET Peter Zijlstra wrote:
> On Tue, Dec 20, 2016 at 12:59:54PM +0100, Steinar H. Gunderson wrote:
> > Hi Peter,
> >
> > I can't find a good point of contact for perf, so I'm contacting you based
> > on the MAINTAINERS file; feel free to redirect somewhere if you're not
> > the right person.
>
> Cc'ed [email protected]
>
> > I'm trying to figure out how to deal with perf report when there are
> > inlined functions; they don't generally seem to show up in the call
> > stack, which sometimes can make it very hard to figure out what is going,
> > especially in a code base one doesn't know too well. As an example, I
> > threw together a>
> > minimal test program:
> > #include <stdlib.h>
> >
> > inline int foo()
> > {
> >
> > int k = rand();
> > int sum = 1;
> > for (int i = 0; i < 10000000000; ++i)
> > {
> >
> > sum ^= k;
> > sum += k;
> >
> > }
> > return sum;
> >
> > }
> >
> > int main(void)
> > {
> >
> > return foo();
> >
> > }
> >
> > Compiling with -O2 -g, and running perf record -g yields:
> > # Samples: 6K of event 'cycles:ppp'
> > # Event count (approx.): 5876825543
> > #
> > # Children Self Command Shared Object Symbol
> > # ........ ........ ....... ................. ......................
> > #
> >
> > 99.98% 99.98% inline inline [.] main
> >
> > ---0x706258d4c544155
> >
> > main
> >
> > 99.98% 0.00% inline [unknown] [.] 0x0706258d4c544155
> >
> > ---0x706258d4c544155
> >
> > main
> >
> > Is there a way I can get it to show “foo” in the call graph? (I suppose
> > also ideally, “foo” and not “main” should show up in a non-graph run.) Of
> > course, this gets even more confusing if foo calls bar, since it now
> > looks like the call chain is main -> bar directly.
> >
> > I have debug information that should be sufficient in the binary, because
> > if>
> > I break in gdb, I definitely get the call stack:
> > Program received signal SIGINT, Interrupt.
> > 0x0000555555554589 in foo () at inline.c:5
> > 5 int k = rand();
> > (gdb) bt
> > #0 0x0000555555554589 in foo () at inline.c:5
> > #1 main () at inline.c:17
> > (gdb)
> >
> > FWIW, this is with perf from 4.10 (git as of a few days ago) and GCC
> > 6.2.1.
>
> OK, so it might be possible with: perf record -g --call-graph dwarf
> but that's fairly heavy on the overhead, it will dump the top-of-stack
> for each sample (8k default) and unwind using libunwind in userspace.
It is not even possible with that, perf report is lacking the steps required
to add inline frames - it will only add "real" frames it gets from either of
the unwind libraries.
I have a WIP patch available for this functionality though, it can be found
here (depends on libbfd, i.e. bfd_find_inliner_info):
https://github.com/milianw/linux/commit/
71d031c9d679bfb4a4044226e8903dd80ea601b3
This is not yet upstreamable, but any early comments would be welcome. I hope
to get some more time to drive this in the coming weeks. If you want to test
it out, checkout my milian/perf branch of this repo, build it like you'd do
the normal user-space perf, then run
perf report -g srcline -s sym,srcline
> The default mechanism used for call-graphs is frame-pointers which are
> (relatively) simple and fast to traverse from kernel space. The down
> side is of course that all your userspace needs to be compiled with
> frame pointers enabled and inlined functions, as you noticed, are
> 'lost'.
>
> There has been talk to attempt to utilize the ELF EH frames which are
> mandatory in the x86_64 ABI (even for C) to attempt a kernel based
> 'DWARF' unwind, but nobody has put forward working code for this yet.
> Also, even if the EH stuff is mapped at runtime, it doesn't mean the
> pages will actually be loaded (due to demand paging) and available for
> use, which also will limit usability. (perf sampling is using
> interrupt/NMI context and we cannot page from that, so we're limited to
> memory that's present.)
While all of this would be nice to have, it is not directly related to
inlining from what I gathered.
Bye
--
Milian Wolff | [email protected] | Software Engineer
KDAB (Deutschland) GmbH&Co KG, a KDAB Group company
Tel: +49-30-521325470
KDAB - The Qt Experts
On Tue, Dec 20, 2016 at 02:27:10PM +0100, Milian Wolff wrote:
> It is not even possible with that, perf report is lacking the steps required
> to add inline frames - it will only add "real" frames it gets from either of
> the unwind libraries.
>
> I have a WIP patch available for this functionality though, it can be found
> here (depends on libbfd, i.e. bfd_find_inliner_info):
>
> https://github.com/milianw/linux/commit/
> 71d031c9d679bfb4a4044226e8903dd80ea601b3
Thanks, I'll be sure to try it out. I assume this works only with -g dwarf?
I.e., for non-graph runs, I will still get the bottom function only, not the
inlined one.
/* Steinar */
--
Homepage: https://www.sesse.net/
Em Tue, Dec 20, 2016 at 02:27:10PM +0100, Milian Wolff escreveu:
> On Tuesday, December 20, 2016 1:17:55 PM CET Peter Zijlstra wrote:
> > On Tue, Dec 20, 2016 at 12:59:54PM +0100, Steinar H. Gunderson wrote:
> > > FWIW, this is with perf from 4.10 (git as of a few days ago) and GCC
> > > 6.2.1.
> >
> > OK, so it might be possible with: perf record -g --call-graph dwarf
> > but that's fairly heavy on the overhead, it will dump the top-of-stack
> > for each sample (8k default) and unwind using libunwind in userspace.
>
> It is not even possible with that, perf report is lacking the steps required
> to add inline frames - it will only add "real" frames it gets from either of
> the unwind libraries.
Have you guys looked at this:
http://lkml.kernel.org/r/[email protected]
I have to review it and maybe you will help me with that ;-)
I've CCed Jin Yao, the author of this series.
- Arnaldo
> I have a WIP patch available for this functionality though, it can be found
> here (depends on libbfd, i.e. bfd_find_inliner_info):
>
> https://github.com/milianw/linux/commit/
> 71d031c9d679bfb4a4044226e8903dd80ea601b3
>
> This is not yet upstreamable, but any early comments would be welcome. I hope
> to get some more time to drive this in the coming weeks. If you want to test
> it out, checkout my milian/perf branch of this repo, build it like you'd do
> the normal user-space perf, then run
>
> perf report -g srcline -s sym,srcline
>
> > The default mechanism used for call-graphs is frame-pointers which are
> > (relatively) simple and fast to traverse from kernel space. The down
> > side is of course that all your userspace needs to be compiled with
> > frame pointers enabled and inlined functions, as you noticed, are
> > 'lost'.
> >
> > There has been talk to attempt to utilize the ELF EH frames which are
> > mandatory in the x86_64 ABI (even for C) to attempt a kernel based
> > 'DWARF' unwind, but nobody has put forward working code for this yet.
> > Also, even if the EH stuff is mapped at runtime, it doesn't mean the
> > pages will actually be loaded (due to demand paging) and available for
> > use, which also will limit usability. (perf sampling is using
> > interrupt/NMI context and we cannot page from that, so we're limited to
> > memory that's present.)
>
> While all of this would be nice to have, it is not directly related to
> inlining from what I gathered.
>
> Bye
>
> --
> Milian Wolff | [email protected] | Software Engineer
> KDAB (Deutschland) GmbH&Co KG, a KDAB Group company
> Tel: +49-30-521325470
> KDAB - The Qt Experts
On Tuesday, December 20, 2016 2:43:41 PM CET Steinar H. Gunderson wrote:
> On Tue, Dec 20, 2016 at 02:27:10PM +0100, Milian Wolff wrote:
> > It is not even possible with that, perf report is lacking the steps
> > required to add inline frames - it will only add "real" frames it gets
> > from either of the unwind libraries.
> >
> > I have a WIP patch available for this functionality though, it can be
> > found
> > here (depends on libbfd, i.e. bfd_find_inliner_info):
> >
> > https://github.com/milianw/linux/commit/
> > 71d031c9d679bfb4a4044226e8903dd80ea601b3
>
> Thanks, I'll be sure to try it out. I assume this works only with -g dwarf?
> I.e., for non-graph runs, I will still get the bottom function only, not the
> inlined one.
There is no -g dwarf to my knowldge. There is only `perf record -g`, which is
the framepointer based unwinding and that should also work. But I only really
tested this WIP branch with `--call-graph dwarf` so far.
I'm not so sure whether I understand your sentence about "non-graph runs". It
has nothing to do with `perf report -g graph` (yes, perf is confusing!).
You'll have to:
perf record [-g | --call-graph lbr | --call-graph dwarf ] (pick one)
perf report -g srcline (and anything else)
Cheers
--
Milian Wolff | [email protected] | Software Engineer
KDAB (Deutschland) GmbH&Co KG, a KDAB Group company
Tel: +49-30-521325470
KDAB - The Qt Experts
On Tue, Dec 20, 2016 at 10:54:50AM -0300, Arnaldo Carvalho de Melo wrote:
> Have you guys looked at this:
>
> http://lkml.kernel.org/r/[email protected]
>
> I have to review it and maybe you will help me with that ;-)
Woot. Is this available in git somewhere? (Or if not, what do I apply it on
top of?)
/* Steinar */
--
Homepage: https://www.sesse.net/
On Tuesday, December 20, 2016 10:54:50 AM CET Arnaldo Carvalho de Melo wrote:
> Em Tue, Dec 20, 2016 at 02:27:10PM +0100, Milian Wolff escreveu:
> > On Tuesday, December 20, 2016 1:17:55 PM CET Peter Zijlstra wrote:
> > > On Tue, Dec 20, 2016 at 12:59:54PM +0100, Steinar H. Gunderson wrote:
> > > > FWIW, this is with perf from 4.10 (git as of a few days ago) and GCC
> > > > 6.2.1.
> > >
> > > OK, so it might be possible with: perf record -g --call-graph dwarf
> > > but that's fairly heavy on the overhead, it will dump the top-of-stack
> > > for each sample (8k default) and unwind using libunwind in userspace.
> >
> > It is not even possible with that, perf report is lacking the steps
> > required to add inline frames - it will only add "real" frames it gets
> > from either of the unwind libraries.
>
> Have you guys looked at this:
>
> http://lkml.kernel.org/r/[email protected]
> l.com
No, haven't seen it. Seems like I should have made my work public earlier to
prevent the duplication of effort.
> I have to review it and maybe you will help me with that ;-)
>
> I've CCed Jin Yao, the author of this series.
Great stuff Jin, I'll try to find some time to review this over the coming
days, instead of trying to push my work further.
Cheers
--
Milian Wolff | [email protected] | Software Engineer
KDAB (Deutschland) GmbH&Co KG, a KDAB Group company
Tel: +49-30-521325470
KDAB - The Qt Experts
Em Tue, Dec 20, 2016 at 03:08:22PM +0100, Steinar H. Gunderson escreveu:
> On Tue, Dec 20, 2016 at 10:54:50AM -0300, Arnaldo Carvalho de Melo wrote:
> > Have you guys looked at this:
> >
> > http://lkml.kernel.org/r/[email protected]
> >
> > I have to review it and maybe you will help me with that ;-)
>
> Woot. Is this available in git somewhere? (Or if not, what do I apply it on
> top of?)
Normally you get it from tip, i.e. from:
git//git.kernel.org/pub/scm/linux/kernel/git/tip/tip.git perf/core
As I sync frequently with Ingo, this way you would get more shielded
from rebases I sometimes do, but if you want the bleeding edge, the
place is:
git://git.kernel.org/pub/scm/linux/kernel/git/acme/linux.git perf/core
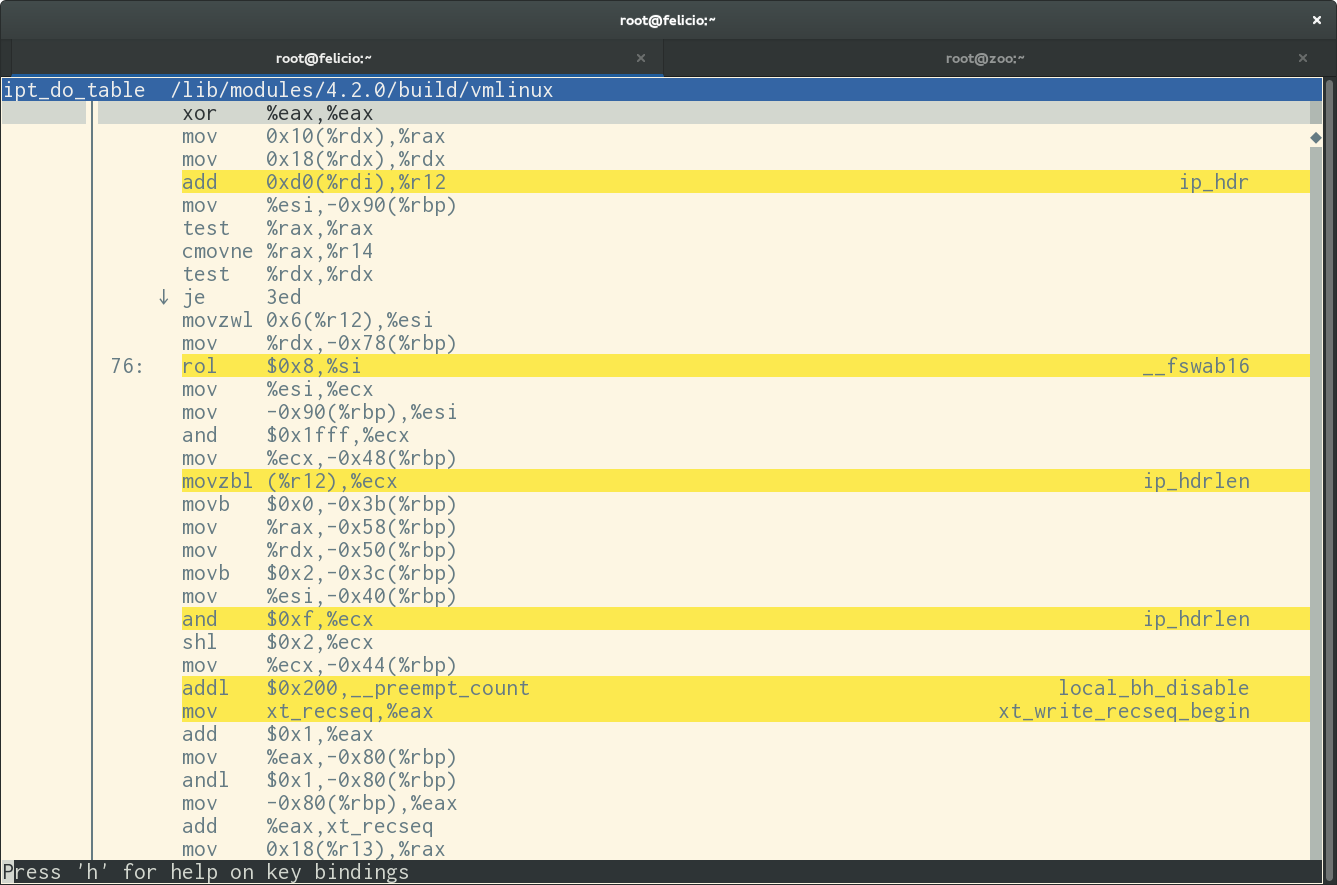
I hope to get back to this soon as I have something else in that area
(inlines) in the backburner, inline annotations, a screenshot I made
last time I touched this area:
http://vger.kernel.org/~acme/perf/inline_annotate/ipt_do_table.png
There are other examples in the same dir:
http://vger.kernel.org/~acme/perf/inline_annotate/
Idea is to highlight the assembly lines for different inlines.
- Arnaldo
On Tue, Dec 20, 2016 at 11:37:46AM -0300, Arnaldo Carvalho de Melo wrote:
>> Woot. Is this available in git somewhere? (Or if not, what do I apply it on
>> top of?)
> Normally you get it from tip, i.e. from:
>
> git//git.kernel.org/pub/scm/linux/kernel/git/tip/tip.git perf/core
I suppose perf/core here means a branch named perf/core in that git
repository, but it doesn't seem to contain the patches in question.
I tried applying them on top of that branch by wget-ing down the right
messages from marc.info, but somehow, I must have misapplied them
(it was rather painful, especially since they seemingly come out-of-order
in the archives), because the resulting tree didn't compile.
/* Steinar */
--
Homepage: https://www.sesse.net/
I just pull my repo with the latest perf/core branch, and apply the
patch one by one (git am 0001/0002/.../0005), they can be applied. Maybe
you have to do like that because the mails are probably coming out of
order.
0000(https://marc.info/?l=linux-kernel&m=148109315020127&w=2)
0001(https://marc.info/?l=linux-kernel&m=148109316620129&w=2)
0002 (https://marc.info/?l=linux-kernel&m=148109313220124&w=2)
0003(https://marc.info/?l=linux-kernel&m=148109320020136&w=2)
0004(https://marc.info/?l=linux-kernel&m=148109316620130&w=2)
0005(https://marc.info/?l=linux-kernel&m=148109318620134&w=2)
I'm using the git
(https://git.kernel.org/pub/scm/linux/kernel/git/acme/linux.git) and
branch (remotes/origin/perf/core).
Thanks
Jin Yao
On 12/21/2016 1:01 AM, Steinar H. Gunderson wrote:
> On Tue, Dec 20, 2016 at 11:37:46AM -0300, Arnaldo Carvalho de Melo wrote:
>>> Woot. Is this available in git somewhere? (Or if not, what do I apply it on
>>> top of?)
>> Normally you get it from tip, i.e. from:
>>
>> git//git.kernel.org/pub/scm/linux/kernel/git/tip/tip.git perf/core
> I suppose perf/core here means a branch named perf/core in that git
> repository, but it doesn't seem to contain the patches in question.
>
> I tried applying them on top of that branch by wget-ing down the right
> messages from marc.info, but somehow, I must have misapplied them
> (it was rather painful, especially since they seemingly come out-of-order
> in the archives), because the resulting tree didn't compile.
>
> /* Steinar */
On Wed, Dec 21, 2016 at 08:53:33AM +0800, Jin, Yao wrote:
> I just pull my repo with the latest perf/core branch, and apply the patch
> one by one (git am 0001/0002/.../0005), they can be applied. Maybe you have
> to do like that because the mails are probably coming out of order.
OK. I applied everything on top of the branch you suggested, and now it's
compiling. But seemingly I don't have too much success; on a quick check
(perf record -p <pid> -g, perf report --inline) I don't get anything marked
as (inline), but I get these warnings:
BFD: Dwarf Error: found dwarf version '6931', this reader only handles version 2, 3 and 4 information.
BFD: Dwarf Error: found dwarf version '18896', this reader only handles version 2, 3 and 4 information.
and so on for many seemingly random version numbers.
It may have been that the stack traces I happened to check don't actually
have any inlined functions in them (the load was a bit different from what
I've looked at earlier), but the BFD errors are new from what I can see.
/* Steinar */
--
Homepage: https://www.sesse.net/
On Wednesday, December 21, 2016 10:58:23 AM CET Steinar H. Gunderson wrote:
> On Wed, Dec 21, 2016 at 08:53:33AM +0800, Jin, Yao wrote:
> > I just pull my repo with the latest perf/core branch, and apply the patch
> > one by one (git am 0001/0002/.../0005), they can be applied. Maybe you
> > have
> > to do like that because the mails are probably coming out of order.
>
> OK. I applied everything on top of the branch you suggested, and now it's
> compiling. But seemingly I don't have too much success; on a quick check
> (perf record -p <pid> -g, perf report --inline) I don't get anything marked
> as (inline), but I get these warnings:
Just to check - did you really compile your code with frame pointers? By
default, that is not the case, and the above will try to do frame pointer
unwinding which will then fail. Put differently - do you any stack frames at
all? Can you try `perf record --call-graph dwarf` instead? Of course, make
sure you compile your code with `-g -O2` or similar.
--
Milian Wolff | [email protected] | Software Engineer
KDAB (Deutschland) GmbH&Co KG, a KDAB Group company
Tel: +49-30-521325470
KDAB - The Qt Experts
On Wed, Dec 21, 2016 at 11:09:42AM +0100, Milian Wolff wrote:
> Just to check - did you really compile your code with frame pointers? By
> default, that is not the case, and the above will try to do frame pointer
> unwinding which will then fail. Put differently - do you any stack frames at
> all? Can you try `perf record --call-graph dwarf` instead? Of course, make
> sure you compile your code with `-g -O2` or similar.
I don't specifically use -fno-omit-frame-pointer, no. But the normal stack
unwinding works just fine with mainline perf nevertheless; is this expected?
/* Steinar */
--
Homepage: https://www.sesse.net/
Could you see the inline if you use the addr2line command? For example,
addr2line -e <app> -i <addr>
For example, in my case,
root@skl:/home/jinyao/skl-ws/perf-dev/lck-2867/test# addr2line -e
./test2 -i 40052d
/usr/include/x86_64-linux-gnu/bits/stdio2.h:104
/home/jinyao/skl-ws/perf-dev/lck-2867/test/test2.c:27
/home/jinyao/skl-ws/perf-dev/lck-2867/test/test2.c:35
/home/jinyao/skl-ws/perf-dev/lck-2867/test/test2.c:45
/home/jinyao/skl-ws/perf-dev/lck-2867/test/test2.c:61
00000000004004f0 <main>:
......
40052d: e8 6e ff ff ff callq 4004a0 <puts@plt>
Thanks
Jin Yao
On 12/21/2016 6:20 PM, Steinar H. Gunderson wrote:
> On Wed, Dec 21, 2016 at 11:09:42AM +0100, Milian Wolff wrote:
>> Just to check - did you really compile your code with frame pointers? By
>> default, that is not the case, and the above will try to do frame pointer
>> unwinding which will then fail. Put differently - do you any stack frames at
>> all? Can you try `perf record --call-graph dwarf` instead? Of course, make
>> sure you compile your code with `-g -O2` or similar.
> I don't specifically use -fno-omit-frame-pointer, no. But the normal stack
> unwinding works just fine with mainline perf nevertheless; is this expected?
>
> /* Steinar */
On Thu, Dec 22, 2016 at 06:56:28AM +0800, Jin, Yao wrote:
> Could you see the inline if you use the addr2line command? For example,
> addr2line -e <app> -i <addr>
I'm sorry, I don't have this profile anymore. I'll try again once we sort out
the problems of the DWARF error messages everywhere.
/* Steinar */
--
Homepage: https://www.sesse.net/