Hi,
This patchset implements callchain support in GTK report browser as
Pekka requested. I put callchain overhead on its own column because
it looks more natural to me. Please take a look and give me comments.
You can get it from 'perf/callchain-gtk-v1' branch on my tree at
git://git.kernel.org/pub/scm/linux/kernel/git/namhyung/linux-perf.git
Any comments are welcome, thanks!
Namhyung
Namhyung Kim (5):
perf gtk/hists: Use GtkTreeStore instead of GtkListStore
perf gtk/hists: Add support for callchains
perf gtk/hists: Display callchain overhead also
perf gtk/hists: Add a double-click handler for callchains
perf gtk/hists: Make column headers resizable
tools/perf/ui/gtk/hists.c | 123 ++++++++++++++++++++++++++++++++++++++++++++--
1 file changed, 118 insertions(+), 5 deletions(-)
--
1.7.11.7
From: Namhyung Kim <[email protected]>
Sometimes it's annoying to see when some symbols have very wierd long
names. So it might be a good idea to make column size changable.
Cc: Pekka Enberg <[email protected]>
Signed-off-by: Namhyung Kim <[email protected]>
---
tools/perf/ui/gtk/hists.c | 7 +++++++
1 file changed, 7 insertions(+)
diff --git a/tools/perf/ui/gtk/hists.c b/tools/perf/ui/gtk/hists.c
index 4e96f7a9f6d1..880110371ca5 100644
--- a/tools/perf/ui/gtk/hists.c
+++ b/tools/perf/ui/gtk/hists.c
@@ -327,6 +327,13 @@ static void perf_gtk__show_hists(GtkWidget *window, struct hists *hists,
}
}
+ do {
+ GtkTreeViewColumn *column;
+
+ column = gtk_tree_view_get_column(GTK_TREE_VIEW(view), col_idx);
+ gtk_tree_view_column_set_resizable(column, TRUE);
+ } while (col_idx--);
+
g_signal_connect(view, "row-activated",
G_CALLBACK(on_row_activated), NULL);
gtk_container_add(GTK_CONTAINER(window), view);
--
1.7.11.7
From: Namhyung Kim <[email protected]>
If callchain is displayed, add "row-activated" signal handler for
handling double-click or pressing ENTER key action.
Cc: Pekka Enberg <[email protected]>
Signed-off-by: Namhyung Kim <[email protected]>
---
tools/perf/ui/gtk/hists.c | 14 ++++++++++++++
1 file changed, 14 insertions(+)
diff --git a/tools/perf/ui/gtk/hists.c b/tools/perf/ui/gtk/hists.c
index 34a09c09748c..4e96f7a9f6d1 100644
--- a/tools/perf/ui/gtk/hists.c
+++ b/tools/perf/ui/gtk/hists.c
@@ -175,6 +175,18 @@ static void perf_gtk__add_callchain(struct rb_root *root, GtkTreeStore *store,
}
}
+static void on_row_activated(GtkTreeView *view, GtkTreePath *path,
+ GtkTreeViewColumn *col __maybe_unused,
+ gpointer user_data __maybe_unused)
+{
+ bool expanded = gtk_tree_view_row_expanded(view, path);
+
+ if (expanded)
+ gtk_tree_view_collapse_row(view, path);
+ else
+ gtk_tree_view_expand_row(view, path, FALSE);
+}
+
static void perf_gtk__show_hists(GtkWidget *window, struct hists *hists,
float min_pcnt)
{
@@ -315,6 +327,8 @@ static void perf_gtk__show_hists(GtkWidget *window, struct hists *hists,
}
}
+ g_signal_connect(view, "row-activated",
+ G_CALLBACK(on_row_activated), NULL);
gtk_container_add(GTK_CONTAINER(window), view);
}
--
1.7.11.7
From: Namhyung Kim <[email protected]>
Add a new column for showing callchain overhead. I feel like it's
more natural than having those overhead next to a first child in a
same column.
Cc: Pekka Enberg <[email protected]>
Signed-off-by: Namhyung Kim <[email protected]>
---
tools/perf/ui/gtk/hists.c | 44 ++++++++++++++++++++++++++++++++++++++------
1 file changed, 38 insertions(+), 6 deletions(-)
diff --git a/tools/perf/ui/gtk/hists.c b/tools/perf/ui/gtk/hists.c
index 14d0b26c7c8a..34a09c09748c 100644
--- a/tools/perf/ui/gtk/hists.c
+++ b/tools/perf/ui/gtk/hists.c
@@ -134,7 +134,7 @@ static void callchain_list__sym_name(struct callchain_list *cl,
}
static void perf_gtk__add_callchain(struct rb_root *root, GtkTreeStore *store,
- GtkTreeIter *parent, int col)
+ GtkTreeIter *parent, int col, u64 total)
{
struct rb_node *nd;
@@ -142,20 +142,36 @@ static void perf_gtk__add_callchain(struct rb_root *root, GtkTreeStore *store,
struct callchain_node *node;
struct callchain_list *chain;
GtkTreeIter iter;
+ double percent;
+ u64 hits;
node = rb_entry(nd, struct callchain_node, rb_node);
+ hits = callchain_cumul_hits(node);
+
+ if (total)
+ percent = 100.0 * hits / total;
+ else
+ percent = 0.0;
+
list_for_each_entry(chain, &node->val, list) {
char buf[128];
gtk_tree_store_append(store, &iter, parent);
- callchain_list__sym_name(chain, buf, sizeof(buf));
+ scnprintf(buf, sizeof(buf), "%5.2f%%", percent);
gtk_tree_store_set(store, &iter, col, buf, -1);
+
+ callchain_list__sym_name(chain, buf, sizeof(buf));
+ gtk_tree_store_set(store, &iter, col + 1, buf, -1);
}
+ if (callchain_param.mode == CHAIN_GRAPH_REL)
+ total = node->children_hit;
+
/* Now 'iter' contains info of the last callchain_list */
- perf_gtk__add_callchain(&node->rb_root, store, &iter, col);
+ perf_gtk__add_callchain(&node->rb_root, store, &iter, col,
+ total);
}
}
@@ -191,8 +207,10 @@ static void perf_gtk__show_hists(GtkWidget *window, struct hists *hists,
col_types[nr_cols++] = G_TYPE_STRING;
}
- if (symbol_conf.use_callchain && sort__has_sym)
+ if (symbol_conf.use_callchain && sort__has_sym) {
+ col_types[nr_cols++] = G_TYPE_STRING;
col_types[nr_cols++] = G_TYPE_STRING;
+ }
store = gtk_tree_store_newv(nr_cols, col_types);
@@ -224,6 +242,11 @@ static void perf_gtk__show_hists(GtkWidget *window, struct hists *hists,
if (symbol_conf.use_callchain && sort__has_sym) {
GtkTreeViewColumn *chain_column;
+ gtk_tree_view_insert_column_with_attributes(GTK_TREE_VIEW(view),
+ -1, "Call %",
+ renderer, "text",
+ col_idx++, NULL);
+
chain_column = gtk_tree_view_column_new();
gtk_tree_view_column_set_title(chain_column, "Callchains");
@@ -278,8 +301,17 @@ static void perf_gtk__show_hists(GtkWidget *window, struct hists *hists,
}
if (symbol_conf.use_callchain && sort__has_sym) {
- gtk_tree_store_set(store, &iter, col_idx, "callchain", -1);
- perf_gtk__add_callchain(&h->sorted_chain, store, &iter, col_idx);
+ u64 total;
+
+ if (callchain_param.mode == CHAIN_GRAPH_REL)
+ total = h->stat.period;
+ else
+ total = hists->stats.total_period;
+
+ gtk_tree_store_set(store, &iter, col_idx + 1,
+ "callchain", -1);
+ perf_gtk__add_callchain(&h->sorted_chain, store, &iter,
+ col_idx, total);
}
}
--
1.7.11.7
From: Namhyung Kim <[email protected]>
The GtkTreeStore can save items in a tree-like way. This is a
preparation for supporting callgraphs in the hist browser.
Cc: Pekka Enberg <[email protected]>
Signed-off-by: Namhyung Kim <[email protected]>
---
tools/perf/ui/gtk/hists.c | 10 +++++-----
1 file changed, 5 insertions(+), 5 deletions(-)
diff --git a/tools/perf/ui/gtk/hists.c b/tools/perf/ui/gtk/hists.c
index 9708dd5fb8f3..cb6a9b45f789 100644
--- a/tools/perf/ui/gtk/hists.c
+++ b/tools/perf/ui/gtk/hists.c
@@ -131,7 +131,7 @@ static void perf_gtk__show_hists(GtkWidget *window, struct hists *hists,
GType col_types[MAX_COLUMNS];
GtkCellRenderer *renderer;
struct sort_entry *se;
- GtkListStore *store;
+ GtkTreeStore *store;
struct rb_node *nd;
GtkWidget *view;
int col_idx;
@@ -156,7 +156,7 @@ static void perf_gtk__show_hists(GtkWidget *window, struct hists *hists,
col_types[nr_cols++] = G_TYPE_STRING;
}
- store = gtk_list_store_newv(nr_cols, col_types);
+ store = gtk_tree_store_newv(nr_cols, col_types);
view = gtk_tree_view_new();
@@ -199,7 +199,7 @@ static void perf_gtk__show_hists(GtkWidget *window, struct hists *hists,
if (percent < min_pcnt)
continue;
- gtk_list_store_append(store, &iter);
+ gtk_tree_store_append(store, &iter, NULL);
col_idx = 0;
@@ -209,7 +209,7 @@ static void perf_gtk__show_hists(GtkWidget *window, struct hists *hists,
else
fmt->entry(&hpp, h);
- gtk_list_store_set(store, &iter, col_idx++, s, -1);
+ gtk_tree_store_set(store, &iter, col_idx++, s, -1);
}
list_for_each_entry(se, &hist_entry__sort_list, list) {
@@ -219,7 +219,7 @@ static void perf_gtk__show_hists(GtkWidget *window, struct hists *hists,
se->se_snprintf(h, s, ARRAY_SIZE(s),
hists__col_len(hists, se->se_width_idx));
- gtk_list_store_set(store, &iter, col_idx++, s, -1);
+ gtk_tree_store_set(store, &iter, col_idx++, s, -1);
}
}
--
1.7.11.7
From: Namhyung Kim <[email protected]>
Add a new column to display callchain information. It's only enabled
when recorded with -g and has symbol sort key.
Cc: Pekka Enberg <[email protected]>
Signed-off-by: Namhyung Kim <[email protected]>
---
tools/perf/ui/gtk/hists.c | 60 +++++++++++++++++++++++++++++++++++++++++++++++
1 file changed, 60 insertions(+)
diff --git a/tools/perf/ui/gtk/hists.c b/tools/perf/ui/gtk/hists.c
index cb6a9b45f789..14d0b26c7c8a 100644
--- a/tools/perf/ui/gtk/hists.c
+++ b/tools/perf/ui/gtk/hists.c
@@ -124,6 +124,41 @@ void perf_gtk__init_hpp(void)
perf_gtk__hpp_color_overhead_guest_us;
}
+static void callchain_list__sym_name(struct callchain_list *cl,
+ char *bf, size_t bfsize)
+{
+ if (cl->ms.sym)
+ scnprintf(bf, bfsize, "%s", cl->ms.sym->name);
+ else
+ scnprintf(bf, bfsize, "%#" PRIx64, cl->ip);
+}
+
+static void perf_gtk__add_callchain(struct rb_root *root, GtkTreeStore *store,
+ GtkTreeIter *parent, int col)
+{
+ struct rb_node *nd;
+
+ for (nd = rb_first(root); nd; nd = rb_next(nd)) {
+ struct callchain_node *node;
+ struct callchain_list *chain;
+ GtkTreeIter iter;
+
+ node = rb_entry(nd, struct callchain_node, rb_node);
+
+ list_for_each_entry(chain, &node->val, list) {
+ char buf[128];
+
+ gtk_tree_store_append(store, &iter, parent);
+
+ callchain_list__sym_name(chain, buf, sizeof(buf));
+ gtk_tree_store_set(store, &iter, col, buf, -1);
+ }
+
+ /* Now 'iter' contains info of the last callchain_list */
+ perf_gtk__add_callchain(&node->rb_root, store, &iter, col);
+ }
+}
+
static void perf_gtk__show_hists(GtkWidget *window, struct hists *hists,
float min_pcnt)
{
@@ -156,6 +191,9 @@ static void perf_gtk__show_hists(GtkWidget *window, struct hists *hists,
col_types[nr_cols++] = G_TYPE_STRING;
}
+ if (symbol_conf.use_callchain && sort__has_sym)
+ col_types[nr_cols++] = G_TYPE_STRING;
+
store = gtk_tree_store_newv(nr_cols, col_types);
view = gtk_tree_view_new();
@@ -183,6 +221,23 @@ static void perf_gtk__show_hists(GtkWidget *window, struct hists *hists,
col_idx++, NULL);
}
+ if (symbol_conf.use_callchain && sort__has_sym) {
+ GtkTreeViewColumn *chain_column;
+
+ chain_column = gtk_tree_view_column_new();
+
+ gtk_tree_view_column_set_title(chain_column, "Callchains");
+ gtk_tree_view_column_pack_start(chain_column, renderer, TRUE);
+ gtk_tree_view_column_add_attribute(chain_column, renderer,
+ "text", col_idx++);
+
+ gtk_tree_view_insert_column(GTK_TREE_VIEW(view),
+ chain_column, -1);
+
+ gtk_tree_view_set_expander_column(GTK_TREE_VIEW(view),
+ chain_column);
+ }
+
gtk_tree_view_set_model(GTK_TREE_VIEW(view), GTK_TREE_MODEL(store));
g_object_unref(GTK_TREE_MODEL(store));
@@ -221,6 +276,11 @@ static void perf_gtk__show_hists(GtkWidget *window, struct hists *hists,
gtk_tree_store_set(store, &iter, col_idx++, s, -1);
}
+
+ if (symbol_conf.use_callchain && sort__has_sym) {
+ gtk_tree_store_set(store, &iter, col_idx, "callchain", -1);
+ perf_gtk__add_callchain(&h->sorted_chain, store, &iter, col_idx);
+ }
}
gtk_container_add(GTK_CONTAINER(window), view);
--
1.7.11.7
From: Namhyung Kim <[email protected]>
Sometimes it's annoying to see when some symbols have very wierd long
names. So it might be a good idea to make column size changable.
Cc: Pekka Enberg <[email protected]>
Signed-off-by: Namhyung Kim <[email protected]>
---
There was a warning when callchains were not used.
tools/perf/ui/gtk/hists.c | 7 +++++++
1 file changed, 7 insertions(+)
diff --git a/tools/perf/ui/gtk/hists.c b/tools/perf/ui/gtk/hists.c
index 4e96f7a9f6d1..00f718094978 100644
--- a/tools/perf/ui/gtk/hists.c
+++ b/tools/perf/ui/gtk/hists.c
@@ -327,6 +327,13 @@ static void perf_gtk__show_hists(GtkWidget *window, struct hists *hists,
}
}
+ for (col_idx = 0; col_idx < nr_cols; col_idx++) {
+ GtkTreeViewColumn *column;
+
+ column = gtk_tree_view_get_column(GTK_TREE_VIEW(view), col_idx);
+ gtk_tree_view_column_set_resizable(column, TRUE);
+ }
+
g_signal_connect(view, "row-activated",
G_CALLBACK(on_row_activated), NULL);
gtk_container_add(GTK_CONTAINER(window), view);
--
1.7.11.7
On 05/22/2013 11:27 AM, Namhyung Kim wrote:
> From: Namhyung Kim <[email protected]>
>
> The GtkTreeStore can save items in a tree-like way. This is a
> preparation for supporting callgraphs in the hist browser.
>
> Cc: Pekka Enberg <[email protected]>
> Signed-off-by: Namhyung Kim <[email protected]>
Reviewed-by: Pekka Enberg <[email protected]>
On 05/22/2013 11:27 AM, Namhyung Kim wrote:
> From: Namhyung Kim <[email protected]>
>
> Add a new column to display callchain information. It's only enabled
> when recorded with -g and has symbol sort key.
>
> Cc: Pekka Enberg <[email protected]>
> Signed-off-by: Namhyung Kim <[email protected]>
Reviewed-by: Pekka Enberg <[email protected]>
On 05/22/2013 11:27 AM, Namhyung Kim wrote:
> From: Namhyung Kim <[email protected]>
>
> Add a new column for showing callchain overhead. I feel like it's
> more natural than having those overhead next to a first child in a
> same column.
>
> Cc: Pekka Enberg <[email protected]>
> Signed-off-by: Namhyung Kim <[email protected]>
Reviewed-by: Pekka Enberg <[email protected]>
On 05/22/2013 11:27 AM, Namhyung Kim wrote:
> From: Namhyung Kim <[email protected]>
>
> If callchain is displayed, add "row-activated" signal handler for
> handling double-click or pressing ENTER key action.
>
> Cc: Pekka Enberg <[email protected]>
> Signed-off-by: Namhyung Kim <[email protected]>
Reviewed-by: Pekka Enberg <[email protected]>
On 05/22/2013 11:37 AM, Namhyung Kim wrote:
> From: Namhyung Kim <[email protected]>
>
> Sometimes it's annoying to see when some symbols have very wierd long
> names. So it might be a good idea to make column size changable.
>
> Cc: Pekka Enberg <[email protected]>
> Signed-off-by: Namhyung Kim <[email protected]>
Reviewed-by: Pekka Enberg <[email protected]>
On 05/22/2013 11:27 AM, Namhyung Kim wrote:
> This patchset implements callchain support in GTK report browser as
> Pekka requested. I put callchain overhead on its own column because
> it looks more natural to me. Please take a look and give me comments.
>
> You can get it from 'perf/callchain-gtk-v1' branch on my tree at
>
> git://git.kernel.org/pub/scm/linux/kernel/git/namhyung/linux-perf.git
>
>
> Any comments are welcome, thanks!
Looks good to me! I'd prefer to see this go in before the more
experimental hierarchy view changes.
Pekka
Em Wed, May 22, 2013 at 05:27:36PM +0900, Namhyung Kim escreveu:
> From: Namhyung Kim <[email protected]>
>
> Add a new column for showing callchain overhead. I feel like it's
> more natural than having those overhead next to a first child in a
> same column.
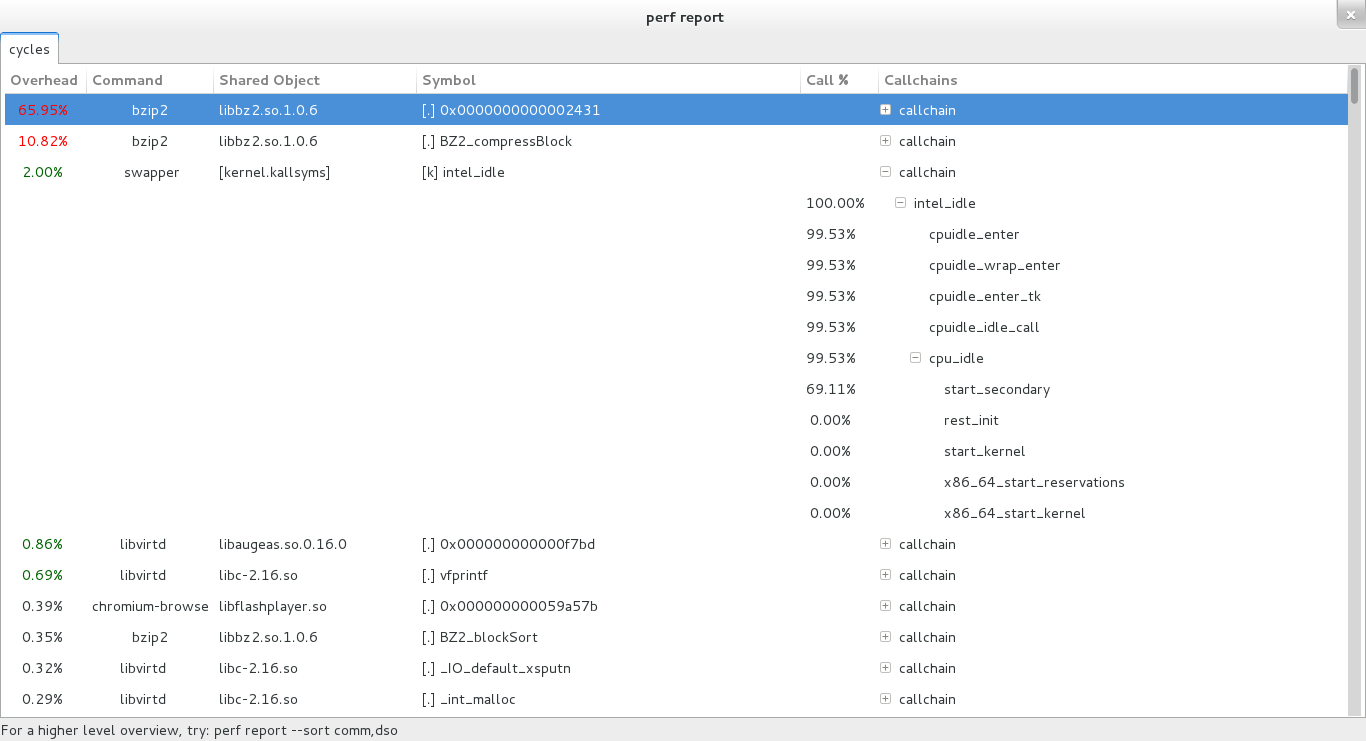
Callchains in GTK, great! Some observations tho:
All those leaves with 0.00% looks ugly/not needed, right?
I took a screenshot and put at:
http://vger.kernel.org/~acme/perf-gtk-callchains.png
all those duplicated "+ callchain" when the callchain is folded, can you
remove those? I.e. leaving just the '+' to allow unfolding.
About using an extra column for the callchains... Can't it be like in
the TUI and in the stdio modes? Think about C++ long symbol names :-)
I'll do some more testing on it and provide further comments, thanks for
doing this work!
- Arnaldo
> Cc: Pekka Enberg <[email protected]>
> Signed-off-by: Namhyung Kim <[email protected]>
> ---
> tools/perf/ui/gtk/hists.c | 44 ++++++++++++++++++++++++++++++++++++++------
> 1 file changed, 38 insertions(+), 6 deletions(-)
>
> diff --git a/tools/perf/ui/gtk/hists.c b/tools/perf/ui/gtk/hists.c
> index 14d0b26c7c8a..34a09c09748c 100644
> --- a/tools/perf/ui/gtk/hists.c
> +++ b/tools/perf/ui/gtk/hists.c
> @@ -134,7 +134,7 @@ static void callchain_list__sym_name(struct callchain_list *cl,
> }
>
> static void perf_gtk__add_callchain(struct rb_root *root, GtkTreeStore *store,
> - GtkTreeIter *parent, int col)
> + GtkTreeIter *parent, int col, u64 total)
> {
> struct rb_node *nd;
>
> @@ -142,20 +142,36 @@ static void perf_gtk__add_callchain(struct rb_root *root, GtkTreeStore *store,
> struct callchain_node *node;
> struct callchain_list *chain;
> GtkTreeIter iter;
> + double percent;
> + u64 hits;
>
> node = rb_entry(nd, struct callchain_node, rb_node);
>
> + hits = callchain_cumul_hits(node);
> +
> + if (total)
> + percent = 100.0 * hits / total;
> + else
> + percent = 0.0;
> +
> list_for_each_entry(chain, &node->val, list) {
> char buf[128];
>
> gtk_tree_store_append(store, &iter, parent);
>
> - callchain_list__sym_name(chain, buf, sizeof(buf));
> + scnprintf(buf, sizeof(buf), "%5.2f%%", percent);
> gtk_tree_store_set(store, &iter, col, buf, -1);
> +
> + callchain_list__sym_name(chain, buf, sizeof(buf));
> + gtk_tree_store_set(store, &iter, col + 1, buf, -1);
> }
>
> + if (callchain_param.mode == CHAIN_GRAPH_REL)
> + total = node->children_hit;
> +
> /* Now 'iter' contains info of the last callchain_list */
> - perf_gtk__add_callchain(&node->rb_root, store, &iter, col);
> + perf_gtk__add_callchain(&node->rb_root, store, &iter, col,
> + total);
> }
> }
>
> @@ -191,8 +207,10 @@ static void perf_gtk__show_hists(GtkWidget *window, struct hists *hists,
> col_types[nr_cols++] = G_TYPE_STRING;
> }
>
> - if (symbol_conf.use_callchain && sort__has_sym)
> + if (symbol_conf.use_callchain && sort__has_sym) {
> + col_types[nr_cols++] = G_TYPE_STRING;
> col_types[nr_cols++] = G_TYPE_STRING;
> + }
>
> store = gtk_tree_store_newv(nr_cols, col_types);
>
> @@ -224,6 +242,11 @@ static void perf_gtk__show_hists(GtkWidget *window, struct hists *hists,
> if (symbol_conf.use_callchain && sort__has_sym) {
> GtkTreeViewColumn *chain_column;
>
> + gtk_tree_view_insert_column_with_attributes(GTK_TREE_VIEW(view),
> + -1, "Call %",
> + renderer, "text",
> + col_idx++, NULL);
> +
> chain_column = gtk_tree_view_column_new();
>
> gtk_tree_view_column_set_title(chain_column, "Callchains");
> @@ -278,8 +301,17 @@ static void perf_gtk__show_hists(GtkWidget *window, struct hists *hists,
> }
>
> if (symbol_conf.use_callchain && sort__has_sym) {
> - gtk_tree_store_set(store, &iter, col_idx, "callchain", -1);
> - perf_gtk__add_callchain(&h->sorted_chain, store, &iter, col_idx);
> + u64 total;
> +
> + if (callchain_param.mode == CHAIN_GRAPH_REL)
> + total = h->stat.period;
> + else
> + total = hists->stats.total_period;
> +
> + gtk_tree_store_set(store, &iter, col_idx + 1,
> + "callchain", -1);
> + perf_gtk__add_callchain(&h->sorted_chain, store, &iter,
> + col_idx, total);
> }
> }
>
> --
> 1.7.11.7
Hi Arnaldo,
Good to see you :)
On Wed, 22 May 2013 11:52:15 +0200, Arnaldo Carvalho de Melo wrote:
> Em Wed, May 22, 2013 at 05:27:36PM +0900, Namhyung Kim escreveu:
>> From: Namhyung Kim <[email protected]>
>>
>> Add a new column for showing callchain overhead. I feel like it's
>> more natural than having those overhead next to a first child in a
>> same column.
>
> Callchains in GTK, great! Some observations tho:
>
> All those leaves with 0.00% looks ugly/not needed, right?
Right. But I'd rather say it's a bug of callchain code. :)
>
> I took a screenshot and put at:
>
> http://vger.kernel.org/~acme/perf-gtk-callchains.png
>
> all those duplicated "+ callchain" when the callchain is folded, can you
> remove those? I.e. leaving just the '+' to allow unfolding.
Sure.
>
> About using an extra column for the callchains... Can't it be like in
> the TUI and in the stdio modes? Think about C++ long symbol names :-)
That's why I made the columns resizable.
I also thought about reusing the existing overhead and symbols columns.
But I thought it might be confusing to contains two different info in a
same column. But I'm not sure what's the better.
>
> I'll do some more testing on it and provide further comments, thanks for
> doing this work!
Thanks a lot!
Namhyung
* Arnaldo Carvalho de Melo <[email protected]> wrote:
> Em Wed, May 22, 2013 at 05:27:36PM +0900, Namhyung Kim escreveu:
> > From: Namhyung Kim <[email protected]>
> >
> > Add a new column for showing callchain overhead. I feel like it's
> > more natural than having those overhead next to a first child in a
> > same column.
>
> Callchains in GTK, great! Some observations tho:
>
> All those leaves with 0.00% looks ugly/not needed, right?
>
> I took a screenshot and put at:
>
> http://vger.kernel.org/~acme/perf-gtk-callchains.png
Looks really nice!
I'm wondering, would it be hard to add alternating lightgrey+white
background colors to make the entries striped and for the horizontal
structure to thus stand out better?
The 'qgit' tool does that for example, to alternate git commit log
entries.
(Extra points for striping only where the line actually begins.)
Thanks,
Ingo
Hi Ingo,
On Tue, May 28, 2013 at 5:48 PM, Ingo Molnar <[email protected]> wrote:
>
> * Arnaldo Carvalho de Melo <[email protected]> wrote:
>
>> Em Wed, May 22, 2013 at 05:27:36PM +0900, Namhyung Kim escreveu:
>> > From: Namhyung Kim <[email protected]>
>> >
>> > Add a new column for showing callchain overhead. I feel like it's
>> > more natural than having those overhead next to a first child in a
>> > same column.
>>
>> Callchains in GTK, great! Some observations tho:
>>
>> All those leaves with 0.00% looks ugly/not needed, right?
>>
>> I took a screenshot and put at:
>>
>> http://vger.kernel.org/~acme/perf-gtk-callchains.png
>
> Looks really nice!
Thanks! :)
>
> I'm wondering, would it be hard to add alternating lightgrey+white
> background colors to make the entries striped and for the horizontal
> structure to thus stand out better?
>
> The 'qgit' tool does that for example, to alternate git commit log
> entries.
>
> (Extra points for striping only where the line actually begins.)
It should be easy, I'll add it in the next spin.
--
Thanks,
Namhyung